

In the world of financial trading—whether you are looking at Forex, CFDs, Gold, or Crypto—information is always overwhelming. You will hear "experts" swear up and down that Moving Averages (MA) are the ultimate truth, while others insist that only Price Action or Smart Money Concepts (SMC) are reliable. Some traders trade based on complex frameworks like Wyckoff or ICT, while others do nothing but watch the clock waiting for the Non-Farm Payrolls (NFP) release.
For beginners, this noise can be paralyzing. For experienced traders, it can be confusing when indicators start contradicting each other.
This article is not a trading guide. Additionally, keep in mind that technical analysis is just one of many Investment Analysis Approaches for Beginners https://vulehuan.com/en/blog/2026/5/investment-analysis-approaches-for-beginners-eZ6mQlMvK4R. It is not a "get rich quick" handbook. Instead, think of it as a topographic map. We will briefly walk through the most popular tools, theories, and concepts. The goal is to help you understand their true nature, so you can decide for yourself which tools align with your own research and risk appetite.
⚠️ Disclaimer & Legal Notice: This article is for educational and informational purposes only and does not constitute investment advice or any recommendation to buy or sell. Readers are solely responsible for complying with the applicable laws and regulations in their country/region of residence. Financial trading carries a high level of risk and can lead to the loss of capital. Always do your own research (DYOR) and consult with an independent financial advisor before making any decisions.
Part 1: The Classical Foundations – Indicators & Volume
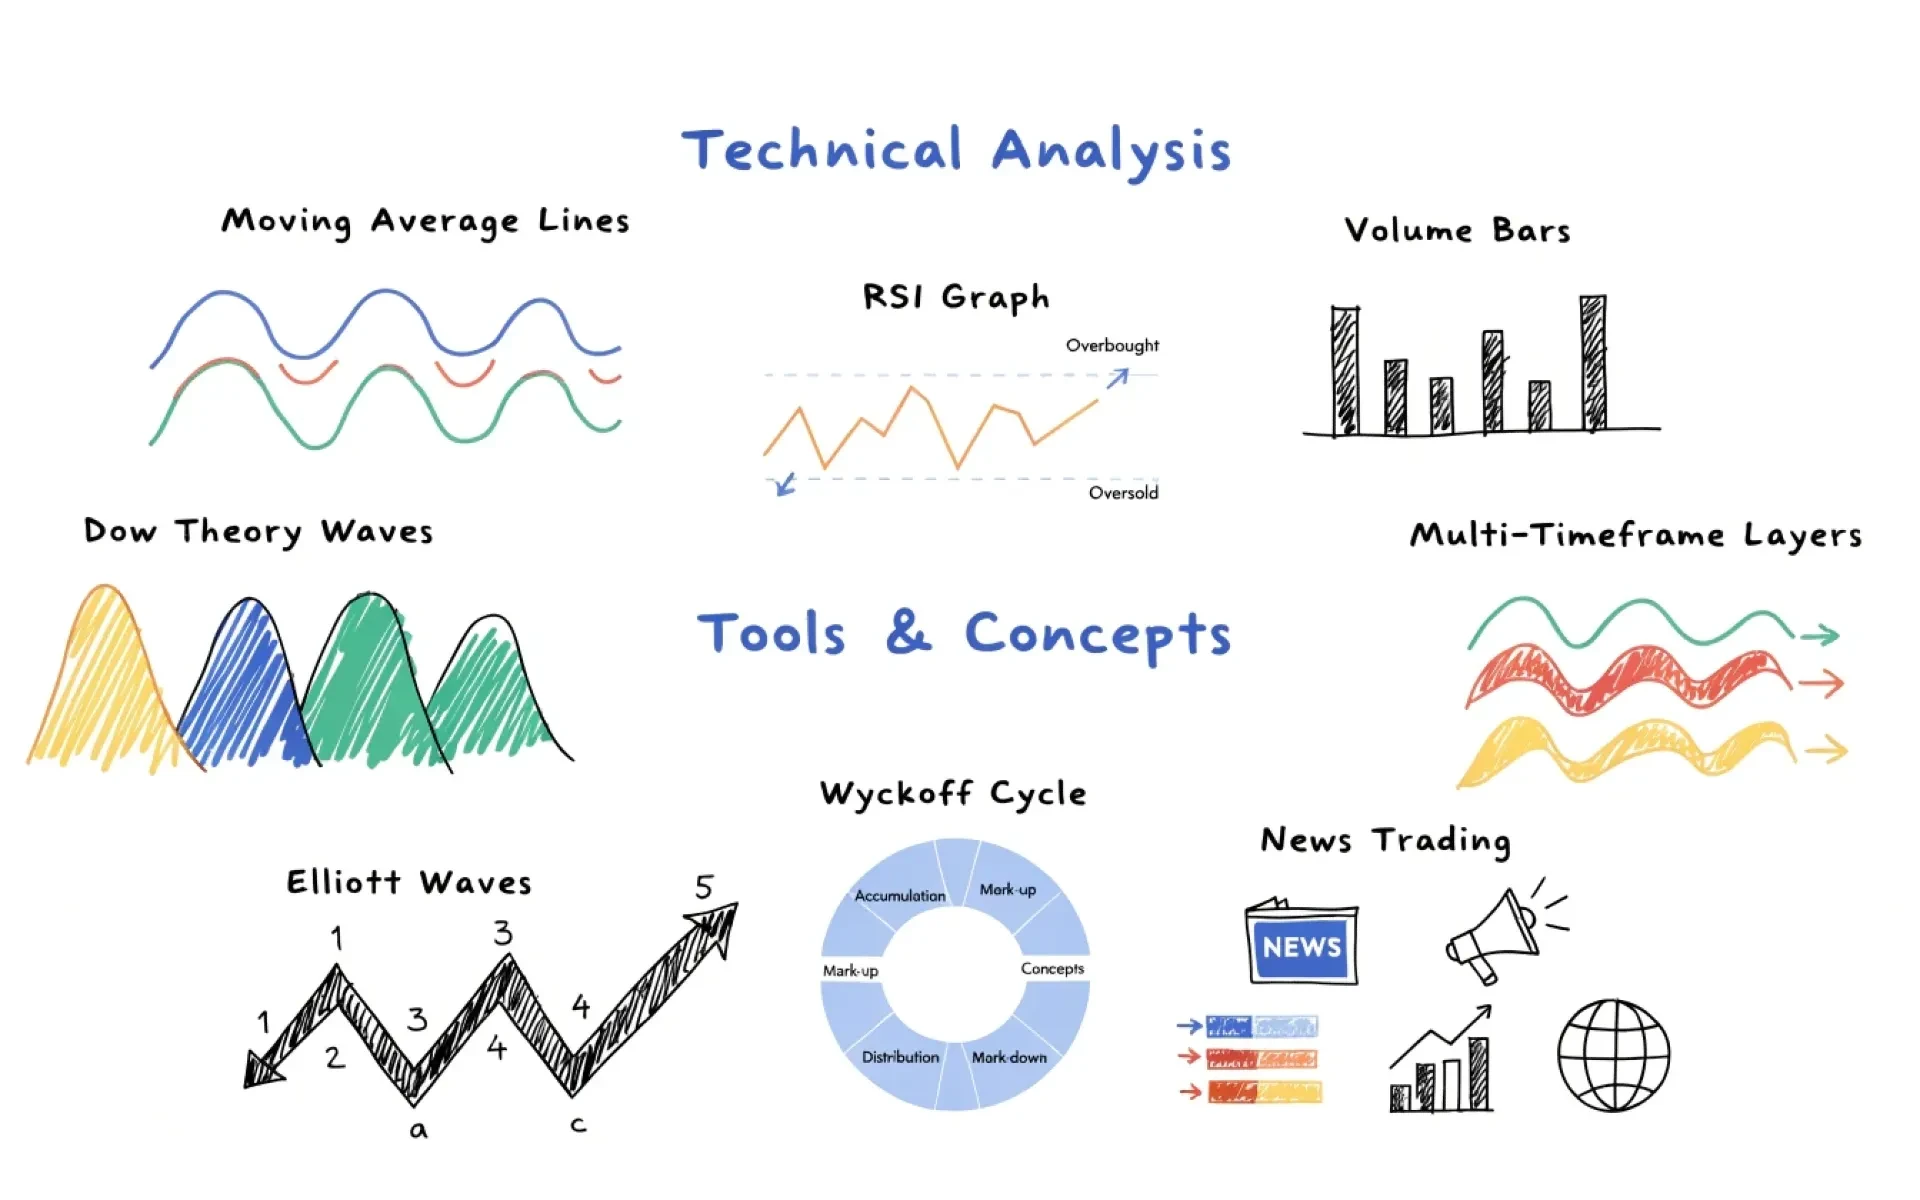
These are the foundational tools available on almost every trading platform. They are mathematical calculations based on historical price and volume data.
Moving Averages (MA & EMA)
- What they are: Tools that smooth out price data to identify trends.
- SMA (Simple): A basic arithmetic average that treats all data points equally.
- EMA (Exponential): Places a higher weight on recent prices, reacting faster than the SMA.
- WMA (Weighted): Assigns a linearly increasing weight to the most recent data points (e.g., today's price matters more than yesterday's, and yesterday's matters more than the day before). WMAs are typically more responsive than SMAs but less "noisy" than EMAs in certain market conditions.
- Common classifications:
- Short-term: EMA 9, SMA 20.
- Medium-term: WMA 45, SMA 50.
- Long-term: SMA/EMA 200.
- A simple example: Price staying above the EMA 200 signals a long-term uptrend. Some traders prefer the WMA 45 because it strikes a good balance between lag and noise, making medium-term trend identification much smoother.
- Takeaway: These are all "lagging" indicators. They confirm a trend that has already formed; they do not predict the future.
Relative Strength Index (RSI)
- What it is: A momentum oscillator that measures the speed and change of price movements on a scale from 0 to 100.
- Practical examples & Notes:
- According to classic theory: An RSI above 70 is "overbought," while an RSI below 30 is "oversold."
- However, don't rush to trade the reversal: In strong momentum trends, the RSI can remain above 70 or below 30 for extended periods. In particular, when the RSI hits extreme readings (above 80 or below 20), it usually reflects incredibly strong buying or selling pressure.
- In practice: Even if price makes a brief corrective pullback, the residual momentum often pushes price back to test or even break the previous highs/lows. Therefore, an overbought or oversold RSI is not an immediate signal to "sell the top or buy the bottom"—it is a reminder of just how strong the current trend is.
Trading Volume
- Traditional Volume:
- What it is: Vertical bars showing the total volume traded during each specific candle interval (H1, H4, D1, etc.).
- How to use it: To gauge the strength of market interest. Price rising on high volume confirms a healthy trend; price rising on low volume warns of a lack of buying pressure.
- Volume Profile:
- What it is: Displays the distribution of trading volume across specific price levels (plotted horizontally along the side of the chart).
- POC (Point of Control): The price level with the highest traded volume, which acts as a major "magnet" for price.
- VA (Value Area): The price range surrounding the POC where roughly 70% of the total volume was traded.
- How to use it: The market frequently tests the upper and lower boundaries of the VA. If price breaks out of the VA and holds, it usually seeks out the next Value Area. The VA acts as a highly effective dynamic support and resistance zone.
- VSA (Volume Spread Analysis):
- What it is: The analysis of the relationship between candle range (body and wicks) and volume.
- Objective: To decode the actions of "Smart Money." For example, a wide-spread bearish candle on ultra-high volume could indicate a Selling Climax, hinting that sellers are exhausted and a reversal is around the corner.
Part 2: Market Structure & Core Theories
Before diving into advanced strategies, you must understand the backbone of technical analysis.
Dow Theory
- Who was Charles Dow? The "grandfather" of technical analysis and the co-founder of The Wall Street Journal.
- The core idea: The market moves in three trends: Primary (long-term), Secondary (corrections), and Minor (noise). Price discounts everything, and volume must confirm the trend.
- Trend structure:
- Uptrend: A series of aggressive rallies followed by minor pullbacks, forming higher highs and higher lows.
- Downtrend: A series of sharp drops followed by minor bounces, forming lower lows and lower highs.
- Why pullbacks occur:
- Profit-taking: Early buyers sell to lock in gains, creating temporary downward pressure.
- Waiting for a better entry: New market participants avoid chasing the rally, patiently waiting for price to pull back to support levels to buy at a better discount.
- Catching a breath: Think of a marathon. A runner (price) cannot sprint indefinitely. They have to slow down or walk for a bit (correct/pull back) to breathe and recover before sprinting again toward the finish line (the main trend). This slowdown is completely normal and necessary for the move to be sustainable.
Multi-Timeframe Analysis
- What it is: Analyzing charts from higher timeframes down to lower timeframes to find optimal entries. The golden rule is to use adjacent timeframes with a ratio of about 4 to 6 times (e.g., D1 ↔ H4, H4 ↔ H1, H1 ↔ M15).
- The concept of "waves within waves": A single candle on a higher timeframe is actually a complete trend (comprising many smaller waves) on a lower timeframe. For example: A corrective pullback on the H4 chart is actually a clear, established downtrend on the H1 chart. When that H1 downtrend exhausts itself, that is exactly when the H4 completes its correction and prepares to resume its move up.
- An intraday trading example:
- The D1 trend is bullish → You only look to buy.
- The H4 chart is pulling back (this is the D1 correction) → You wait patiently.
- The H1 chart starts showing signs of a bullish reversal → This is your potential entry point, as it aligns with the H4 pullback ending and the D1 trend resuming.
- Takeaway: Do not jump too far across timeframes (e.g., going directly from D1 to M5), as the noise will be too high. Stick to a structured chain like D1 → H4 → H1 → M15 for consistent analysis.
Part 3: Price Action & Advanced Schools of Thought
When traders want to eliminate the lag of indicators, they usually switch to studying pure price behavior or order flow models.
Fair Value Gap (FVG) / Imbalance
- What it is: A price gap that occurs when buying or selling pressure is so intense that it creates a large-bodied candle, leaving a zone where orders were not balanced between buyers and sellers. This is a sign of a supply and demand "imbalance," and the market often retraces to fill this liquidity void before continuing the trend. This concept is highly prominent in ICT and SMC.
- A simple example: Imagine the price jumps instantly from $100 to $105 without any transactions occurring at the $101–$104 levels. That $101–$104 zone is an FVG. Price will typically be "pulled" back into this area to fill the gap before rallying up to $110.
- Supporting tools: You don't need to draw these manually or do complex math. On platforms like TradingView, there are free built-in indicators that automatically scan and highlight these zones on your chart with a single click.
OHLC Data (Open, High, Low, Close)
- What it is: A method of using the four key price points of the previous Day (D1), Week (W1), or Month (M1) as fixed support and resistance levels for the current session. Traders pay particularly close attention to the Close and Open prices.
- A simple example:
- Suppose Gold closed last month at $2,000. This month, if price returns to test $2,000, that level will act as a major psychological wall (support or resistance) because it was where market participants took profits or shifted positions.
- If price breaks aggressively through $2,000 and holds above it, market sentiment turns more bullish, signaling that momentum may continue. If it fails to break, price could sharply bounce off it.
- Takeaway: Higher-timeframe OHLC levels (Weekly/Monthly) carry far more psychological weight than daily levels. These are the key "milestones" where algorithms and large institutions often place their pending orders.
Pure Price Action
- What it is: A trading method based entirely on the raw price movements on a "naked" chart (free of lagging indicators like MAs, RSI, etc.). Traders rely on three primary pillars: Market Structure (uptrends/downtrends), Candlestick Patterns (Pinbars, Engulfing patterns), and Supply and Demand Zones (Support/Resistance) to make decisions.
- Core philosophy: "Price is the news." All fundamental data, crowd psychology, and institutional order flow are instantly reflected in the price. Therefore, instead of waiting for a lagging indicator to confirm a move, a Price Action trader reads the direct intent of the market.
- A simple example:
- Instead of waiting for the RSI to drop below 30 to consider a buy, a Price Action trader notices the price hitting a major support level and forming a long-wicked rejection candle (Pinbar). This shows that sellers tried to push the price down but failed, and buyers are taking control → An immediate buy signal is triggered right then.
- Identifying a Double Bottom or a Head and Shoulders pattern directly on a clean chart to anticipate a reversal point.
- Takeaway: Price Action is not a holy grail. It requires a sharp eye and experience to filter out noise from valid signals. However, its greatest advantage is its real-time nature: you react instantly with the market, completely bypassing indicators' lag.
9. The Major Trading Schools: Wyckoff, Elliott, ICT, Bob Volman, SMC
These are complex trading systems that require deep study. Each school of thought has its own "language" to explain market behavior.
- Wyckoff Method:
- Core concept: Focuses on the market cycle managed by the "Composite Man" (market makers/large institutions). Markets do not move randomly; they go through four phases: Accumulation (buying up supply), Markup (uptrend), Distribution (unloading positions), and Markdown (downtrend).
- Application: Traders look to buy alongside the "whales" during the accumulation phase and sell when distribution begins.
- Elliott Wave Theory:
- Core concept: Based on crowd psychology, the market moves in a repetitive wave structure: 5 impulse waves (with the main trend) and 3 corrective waves (against the trend).
- Application: Helps traders pinpoint exactly where price stands within a major cycle so they know whether to wait patiently or get ready to jump in. However, counting waves is highly subjective and often debated.
- ICT (Inner Circle Trader) & SMC (Smart Money Concepts):
- Core concept: These two are closely linked. They argue that markets are not entirely free-moving but are governed by interbank algorithms (IPDA) designed to hunt for liquidity (Liquidity Grab).
- SMC focuses on specific concepts like Order Blocks (institutional order zones), Breaker Blocks, Fair Value Gaps (FVG), and Change of Character (CHoCH).
- Application: SMC/ICT traders do not chase the price. Instead, they wait for the market to run the retail crowd's stop-losses (capturing liquidity) at previous highs or lows before getting into the market alongside smart money.
- Bob Volman (Price Action Compression):
- Core concept: A highly practical Price Action approach that centers on price compression. When the price moves sideways in a tight range on low volume, it acts like a coiled spring.
- Application: Traders wait for a clean breakout from the compressed range, confirmed by both the candle and volume. This method is famous for its strict discipline and mechanical entry rules, leaving less room for ambiguity compared to Elliott Wave.
- Important Note:
- Every framework has its own logic. An "Accumulation" zone in Wyckoff might be called a "Range" in basic Price Action, or a "Liquidity Pool" in ICT/SMC.
- Beginners should avoid learning everything at once. Pick one methodology that fits your personality (e.g., if you prefer clear-cut rules, go for Bob Volman or SMC; if you like big-picture macro analysis, pick Wyckoff or Elliott) and master it. Mixing too many methods will only lead to information overload.
Part 4: Complementary Tools & Macro Factors
The markets do not just move on technicals; they are also heavily impacted by timing and fundamental news.
Fibonacci Retracement & Extension
- What it is: A tool used to measure the levels of a price correction or expansion based on the mathematical Fibonacci sequence. The most popular ratios are 0.382, 0.5, 0.618 (the golden ratio), and 1.618.
- A simple example: After Gold surges from $1,800 up to $1,900, the price starts pulling back. A trader draws the Fibo tool from the bottom to the top. The $1,860 area (corresponding to the 0.618 Fibo level) is often considered the "Golden Zone"—the most likely area where buyers will step in to defend the trend.
- Takeaway: Fibonacci works best when the levels align perfectly with structural support and resistance. It is a subjective tool because its accuracy depends entirely on picking the right swing high and low to draw from.
Gann Angles
- What it is: A classic technical analysis method developed by W.D. Gann, based on the principle that "Price and Time have a geometric relationship." Unlike Fibonacci, which focuses only on price levels, Gann believed that the market is in balance when price and time move in specific proportions (e.g., 1 unit of price corresponds to 1 unit of time).
- Key tool: The Gann Fan, which consists of several diagonal lines radiating from an important high or low. The most critical line is Gann 1x1 (45 degrees), representing the most sustainable and balanced trend.
- A simple example:
- If price stays above the Gann 1x1 line, the market is in a healthy uptrend.
- If price breaks below the Gann 1x1 line, it warns that the uptrend has weakened and could turn sideways or bearish.
- Traders use these lines as dynamic diagonal support and resistance levels on their charts.
- Takeaway: Gann angles are incredibly sensitive to chart scaling. If you zoom in or out incorrectly, the angles get warped. Therefore, it requires a much more precise chart setup than standard indicators.
Trading Sessions & Market Opens
While the market is open 24/5, liquidity fluctuates heavily depending on the session:
- Characteristics of the 3 Major Sessions:
- Asian Session (Tokyo/Sydney): Early morning, low volatility, price often moves sideways.
- European Session (London): Afternoon, a huge surge in liquidity, and the intraday trend usually forms.
- US Session (New York): Late evening, highly volatile, especially when major economic data is released.
- The "Golden" Hours for Gold (XAU/USD):
- The optimal time is the London/New York overlap (roughly 7:00 PM – 11:00 PM Vietnam time, depending on the season). This is when the two biggest pricing hubs—London (LBMA) and New York (COMEX)—are operating simultaneously, generating massive volume and tight spreads.
- Auction Market Theory & The Opening Range:
- The first hour is incredibly crucial: Many professional traders live by the rule "do not trade the first hour" after the New York open (or when the gold session restarts).
- Why? This is the Opening Auction phase, where overnight pending orders are matched, and "Smart Money" frequently creates fakeouts to trap the opposing side before setting the true direction for the day.
- Strategy: Instead of entering right at the open, traders often wait for the first hour to close to establish the Initial Balance (the initial high-to-low range). If the price breaks out of this range on volume, that usually points to the main direction of the session.
A note on Daylight Saving Time (DST): Europe and the US shift their clocks twice a year. This causes trading session times to shift by one hour relative to your local time. Always double-check your chart's timezone settings to ensure your timing analysis stays accurate.
Economic News (Fundamentals)
It might feel a bit "off" to see news factors - a core part of Fundamental Analysis - included in an overview of Technical Analysis. However, the reality is that in real-world trading, these two schools of thought are not mutually exclusive; they actually complement each other perfectly. News acts as the catalyst that drives volatility and capital flow, while technical analysis tools (such as Support/Resistance zones, FVG, or RSI) help you map out your game plan. This allows you to set your Take Profit (TP) and Stop Loss (SL) levels more smoothly and securely when the market reacts to the news.
- Non-Farm Payrolls (NFP): The US employment report, released on the first Friday of every month. It causes massive volatility for the US Dollar and Gold.
- Other major releases: Federal Reserve interest rate decisions, CPI (inflation), GDP, and geopolitical events.
- A simple example: Even if your technical chart screams "Buy," if the NFP report comes in much better than expected (surging the USD), Gold can crash straight down, ignoring every technical support level in its way.
Part 5: Reality & Advice for Beginners
The Paradox of Combination
A very common mistake beginners make is trying to stack every single tool onto one chart.
- The MA points to Buy.
- The RSI says Sell (due to being overbought).
- There is an unfilled FVG below.
- An upcoming news release creates total uncertainty.
The result? Analysis Paralysis. You are too afraid to make a move, or worse, you make a random decision and take a loss.
The Role of Experience
No tool works 100% of the time.
- Dow Theory helps you understand trend direction.
- Volume helps you confirm trend strength.
- News gives you the underlying macro context.
How you combine these methods is entirely down to your personal style. Some traders only need Price Action and Volume. Others need Fibonacci levels and MAs. What matters most is consistency and risk management, not the sheer number of indicators on your chart.
Top 20 Frequently Asked Questions About Technical Analysis (Q&A)
Here are brief answers to the most common questions, giving you a quick recap of the concepts we've covered.
Group 1: Basics & Indicators
- What is the difference between SMA and EMA? The SMA reacts slower but filters out noise; the EMA reacts faster to recent prices but can be easily "fooled" by short-term noise.
- Does an overbought RSI mean I should sell immediately? Not necessarily. In strong uptrends, the RSI can remain overbought for a long time. You should check the price structure as well.
- Is volume more important than price? Volume is the fuel for price. A rally on low volume is usually weak and prone to reversal. A rally on high volume indicates a strong, valid trend.
- How is Volume Profile different from standard volume? Standard volume is calculated over time (vertical bars at the bottom). Volume Profile is calculated at specific price points (horizontal bars on the side), showing exactly which price saw the most trading activity.
- What is VSA? It is the practice of reading institutional footprints by looking at the relationship between candle ranges and volume.
Group 2: Theory & Market Structure
- Is Dow Theory still valid? Yes, it remains the foundation for thinking about trends, even though modern markets are more complex. The principle that "A trend remains in effect until it signals a reversal" still holds true.
- Why do I need Multi-Timeframe analysis? To avoid getting trapped in short-term noise. The higher timeframe shows the direction; the lower timeframe gives you the entry point.
- What is a Fair Value Gap (FVG)? It is a price zone that reflects a sudden imbalance between supply and demand, where price often returns to "fill the gap" before resuming its original path.
- Why are the previous week's or month's Open and Close prices important? They act as major psychological levels where institutional algorithms often place pending orders.
- How does Price Action differ from indicators? Price Action reads raw price data. Indicators are derivatives (calculated from price data). Price Action is usually faster but comes with a steeper learning curve.
Group 3: Advanced Schools of Thought
- Are Wyckoff and ICT contradictory? Not really. Both seek out the footprints of "Smart Money." Wyckoff focuses on the macro cycle, while ICT drills down into micro structure and timing.
- Is Elliott Wave analysis subjective? Yes. Different traders can count waves very differently on the exact same chart, leading to conflicting conclusions.
- How does Bob Volman trade? He focuses on price compression patterns and enters on the breakout once it's confirmed by the candle and volume.
- What does ICT stand for? Inner Circle Trader—a method focused on liquidity runs and the algorithmic manipulation of price.
Group 4: Timing & News
- What is the best session to trade? It depends on the currency pair. EUR/USD is most active during the London/New York overlap. USD/JPY is active during the Asian/New York sessions. Gold moves the most during the European/US overlap.
- How does the Gold market open affect things? When the two major financial hubs—London (LBMA) and New York (COMEX)—overlap, market liquidity spikes. However, in the opening minutes of a session, the spread can widen temporarily due to order imbalances, often accompanied by sharp, unpredictable swings.
- What is the Non-Farm Payrolls (NFP) report? A key US jobs report that directly drives the strength of the US Dollar. Gold and the USD typically move in opposite directions when it is released.
- What other news events are important? The CPI (inflation), Federal Reserve interest rate decisions (FOMC), GDP releases, and geopolitical events.
- Where do you draw a Fibonacci from? From the swing low to the swing high (for an uptrend) or swing high to swing low (for a downtrend) of a distinct wave.
- How many methods should I combine? The best advice is "Less is More." Pick 1 or 2 complementary tools (e.g., Trend + Momentum) rather than cluttering your chart with everything.
Closing Thoughts
Technical analysis is an art of probabilities, not an exact science. Tools like moving averages, the RSI, Wyckoff, SMC, or ICT are just flashlights to help you find your way in the dark. They cannot predict the future, and they will occasionally contradict each other.
Live market experience, strict risk management, and emotional control are the real factors that determine your long-term survival in the market. Use this article as a stepping stone for further self-directed study—never trade solely based on a single article or advice on the internet.
We wish you a cool head and clear thinking in every decision you make.
⚠️ Disclaimer & Legal Notice: This article is for educational and informational purposes only and does not constitute investment advice or any recommendation to buy or sell. Readers are solely responsible for complying with the applicable laws and regulations in their country/region of residence. Financial trading carries a high level of risk and can lead to the loss of capital. Always do your own research (DYOR) and consult with an independent financial advisor before making any decisions.